Natural Disasters
GEOG 1700-400
Summer Semester 2014
COURSE DESCRIPTION
Students will be introduced to natural disasters; the processes and energy sources that produce them, along with the spatial distribution and pattern of natural phenomena, while developing an understanding of the impact these phenomena have on human activity.
- Determine what the roles are of natural disaster mitigation at a federal and local governmental level, community level, and individual.
- Analyze and understand natural processes that create disaster events such as: earthquakes, volcanoes, landslides, tsunamis, severe weather, disease, and climate change.
- Understand how natural hazards become disasters and ultimately catastrophes.
- Know how many natural processes are cylindrical meaning that they a frequency of recurrence which also influences their magnitude.
- Analyze the role humans play in creating natural disasters (i.e. population growth, poverty, environmental degradation, climate change, and politics).
- Understand the technology used to measure and analyze natural processes such as satellite imagery, aerial photography, Geographic Information Systems (GIS), Global Positioning Systems (GPS), and ground data.

|
Course Syllabus - GEOG 1700.pdf Size : 142.035 Kb Type : pdf |
Severe Weather Analysis
SPC Watch Description
Note: The expiration time in the watch graphic is amended if the watch is replaced, cancelled or extended.
Note: Click for Watch Status Reports.
SEL0
URGENT - IMMEDIATE BROADCAST REQUESTED
SEVERE THUNDERSTORM WATCH NUMBER 420
NWS STORM PREDICTION CENTER NORMAN OK
100 PM MDT MON JUL 14 2014
THE NWS STORM PREDICTION CENTER HAS ISSUED A
* SEVERE THUNDERSTORM WATCH FOR PORTIONS OF
CENTRAL AND SOUTHEAST COLORADO
* EFFECTIVE THIS MONDAY AFTERNOON AND EVENING FROM 100 PM UNTIL 700 PM MDT.
* PRIMARY THREATS INCLUDE...
SCATTERED LARGE HAIL EVENTS TO 1.5 INCHES IN DIAMETER POSSIBLE ISOLATED DAMAGING WIND GUSTS TO 70 MPH POSSIBLE
THE SEVERE THUNDERSTORM WATCH AREA IS APPROXIMATELY ALONG AND 55 STATUTE MILES EAST AND WEST OF A LINE FROM 15 MILES NORTHWEST OF DENVER COLORADO TO 40 MILES EAST SOUTHEAST OF TRINIDAD COLORADO.
FOR A COMPLETE DEPICTION OF THE WATCH SEE THE ASSOCIATED WATCH OUTLINE UPDATE (WOUS64 KWNS WOU0).
PRECAUTIONARY/PREPAREDNESS ACTIONS...
REMEMBER...A SEVERE THUNDERSTORM WATCH MEANS CONDITIONS ARE FAVORABLE FOR SEVERE THUNDERSTORMS IN AND CLOSE TO THE WATCH AREA. PERSONS IN THESE AREAS SHOULD BE ON THE LOOKOUT FOR
THREATENING WEATHER CONDITIONS AND LISTEN FOR LATER STATEMENTS AND POSSIBLE WARNINGS. SEVERE THUNDERSTORMS CAN AND OCCASIONALLY DO PRODUCE TORNADOES.
&&
OTHER WATCH INFORMATION...CONTINUE...WW 417...WW 418...WW 419...
DISCUSSION...THUNDERSTORMS ARE FORMING OVER THE HIGHER TERRAIN OF THE FRONT RANGE...AS WELL AS OVER SOUTHEAST CO. THIS ACTIVITY WILL AFFECT THE WATCH AREA THROUGH THE EARLY EVENING...WITH SUFFICIENT EFFECTIVE SHEAR FOR ORGANIZED/SUPERCELL STORMS. HAIL AND DAMAGING WINDS WILL BE POSSIBLE IN THE STRONGEST STORMS.
AVIATION...A FEW SEVERE THUNDERSTORMS WITH HAIL SURFACE AND ALOFT TO 1.5 INCHES. EXTREME TURBULENCE AND SURFACE WIND GUSTS TO 60 KNOTS. A FEW CUMULONIMBI WITH MAXIMUM TOPS TO 500. MEAN STORM
MOTION VECTOR 31030.
...HART
I pulled watch status report around 5pm on Monday, July 14th. The Storm Prediction Center issued a severe thunderstorm watch for portions of central and southeast Colorado. It was effective until 7pm (2 hours after I pulled the report). The center specified that a thunderstorm watch means that the atmospheric conditions are just right for them to form. They say that those within the watch area should be vigilant of threatening weather conditions, especially since these severe thunderstorms can occasionally produce tornadoes.
The book describes thunderstorms as a storm that potentially contains both lightning and thunder. The perfect condition for a thunderstorm is having ‘warm, moist, and unstable air’. This air is forced up by ‘convection, convergence, orographic uplift, or weather fronts. Ultimately, the rising conditions create many types of cumulus clouds. This is the first stage of the “thunderstorm genesis”. The mature stage begins when precipitation begins falling from the clouds. The downdrafts force the cloud out and it becomes wider. When the thunderstorm begins to weaken it reaches its dissipating stage. This is when the downdrafts “overtake the updrafts” and ultimately this prevents latent heat energy from escaping. The remaining precipitation in the cloud is evaporated back into the atmosphere.
The watch status report also warns of possible scattered large hail up to the size of 1.5 inches. Hail forms only in cumulonimbus clouds. The lower portion of the cloud contains liquid water and the upper portion of the cloud is cold enough to turn the liquid into ice pellets. The liquid jumps back and force between the bottom and top of the cloud where it continues to refreeze. Once it weighs too much for the cloud to support it falls from the sky.
Along since there is hail, supercells are also likely to form (as stated in the watch report). Ultimately this would be what would produce the hail, but it could potentially also produce damaging winds. Supercells can produce winds reaching over 100 miles per hour. These are also where the majority of tornadoes form.
Analyzing Images
Doppler Radar
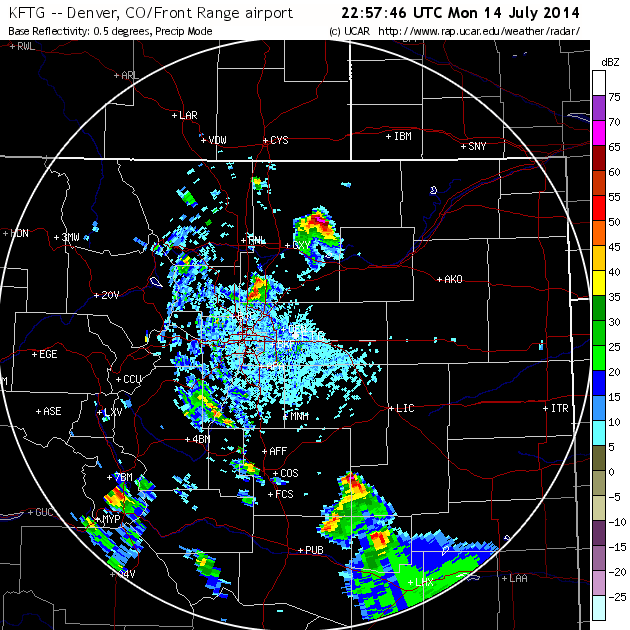
At the time I pulled this the radar was coming in with light precipitation for most of the area that is being focused on. The major color present, light blue, is what indicated this. There is some green coloring especially to the lower right hand portion. The vibrant red bits is where the heaviest participation is present.
Doppler radar is used by sending our radar beams that bounce off rain, hail, snow, or other precipitation and then returns to the instrument for measurement. This helps in forecasting storms, mostly aiding in knowing which direction a storm is headed, and most importantly to distinguish between precipitation and storm rotation. Even though we have Doppler radar those experiencing the storm first hand would end up with the more accurate information than the Doppler radar could pick up. This all depends on how far away the instrument is to the storm. With the image to the right the more vibrant of colors the heavier the percipitation. So the heaviest percipitation is on the Southeast part of the circle.
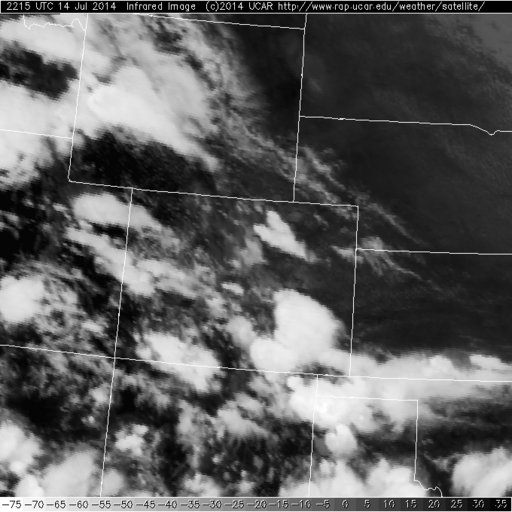
Inferred Image
Visible Image
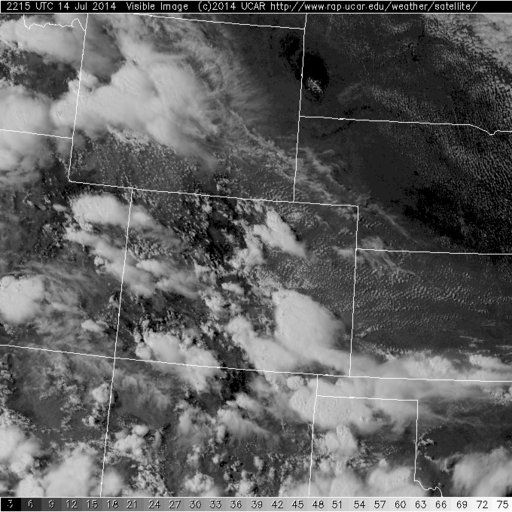
I’m afraid that by the time I pulled these images that the storm was nearly over. The section that I focused in the Doppler radar had current weak storms taking place. Either there wasn’t too much cloud coverage at the time, or the storm wasn’t as cold to be picked up, or the storm was dissipating altogether. The heaviest or coldest clouds in Colorado were in the Southeast corner of the state. There is hardly a difference between the inferred and visible satellite image. With reading the temperature of the cloud, this is determined by measuring the wavelength and radiation from the cloud. In the inferred image, typically darker clouds are warmer and the lighter ones are colder.
Reflection
2. As you are well aware, satellite imagery and aerial photography are freely available for almost the entire world thanks to Internet programs like Google Earth. Should citizens become better at interpreting their world from an aerial viewpoint and what ethical and civil liberty issues might or should concern citizens about this technology?
RESPONSE:
Yes, we all should definitely become better at interpreting our world using the satellite imagery especially since it is freely available to us. Earlier in the course we talked about emergency situations and how using maps generated by GIS might be helpful and even crucial. From that viewpoint it would definitely be helpful to have them accessible in order to prepare for potential disasters (earthquakes, tsunamis, hurricanes, etc...). Some innovative ways that GIS and satellite imagery can be used by any of us has grown far beyond just a 'simple' use of a GPS receiver in order to find where we are going. The video mentions how we are using them every day to pinpoint where businesses are and browsing the ratings of prospective restaurants we'd like to try out. It's beneficial for me to be able to use google maps to find out what the name of a business is when I remember where it is but have forgotten its name. As a hobby, some people use GIS technology to participate in geocaching, a real world treasure hunting game using GPS.
Now as for the ethical and civil liberty concerns that might be brought up due to this advancing technology, I think that the good far out weight the bad. There have been countries in the world that have banned google from taking street views. For a lot of people that has been an ongoing issue here but google has done a great job at blurring out anything that might need to stay private. Privacy, I think, is the biggest concern… however I don’t see how this is any different than us actually visiting a location. The imagery doesn’t go inside buildings so I don’t know how this can really become a negative ethical/ civil liberty issue.
3. Reflect on how you thought about earthquakes in Utah before you started this assignment and how you think about it now that the course is over. Have any of your assumptions or understandings changed? Why?
If anything I am now more terrified of the thought of having an earthquake in Utah. Although this has helped open up my mind to what needs to be done to prepare for a potential earthquake. I’ve purchased extra water and non-perishable food, checked my water heater to make sure it’s strapped down, and discussed some plans with my family in case there is a disaster.
Liquefaction is something that I had heard of previously heard of but didn’t understand. I thought that the foundations of buildings would crack creating potential flooding. However it’s quite a bit more serious than that. The buildings could actually sink into the ground or even tip over like the picture in our text book. If buildings are too close together they could topple over on one another. Using that link in the text book that shows you the liquefaction map of Salt Lake County I found that I live in the maroon colored bit. That means where I live has a high potential for liquefaction.
During the module where we learned about Japan’s disaster I got to thinking about our preparedness here. We watched a video that showed the debris fires from the oil (from factories) and natural gas (from ruptured lines) burning 100s of square miles on fire. Again, for me this is actually quite terrifying to think about. How prepared are we here with our refineries and our natural gas lines if we have an earthquake? How prone will we be to debris and buildings catching on fire? I certainly now have a different mindset on earthquakes happening in Utah. We don’t know when it will happen but we can prepare for it.
My favorite quotes pertaining to predicting natural disasters:
“We can’t prevent it, but we can prepare for it” Simon Boxall, Nat’l Oceanography Ctr. Southampton
“It’s foolish to think that we can stop a natural phenomenon. What we’ve got to do is learn how to live with them and minimize the consequences [that] will one day happen.” Costas Synolakis, Coastal Engineer, US